G2A
Tabužky
Kontakt: palkovaj@yahoo.com
Dátum poslednej aktualizácie ... 27.januára 2008
12. Rozhodovanie II a náhodné hodnoty
 MYP1 |
MYP2 |
MYP3 |
MYP4 |
MYP5 |
G2A
1. Constants
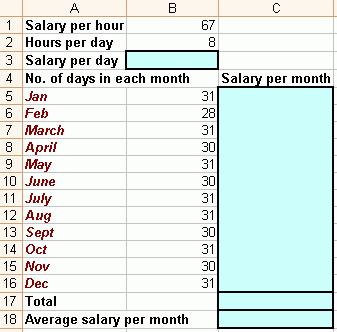
If we wish to use a constant in our calculations, we need to use sign $ inside the call to the cell where we have the constant. For example $A$1 will lock this cell inside the calculation and the number will stay the same even if we copy the calculation for numbers in other rows/columns. $A1 will lock only the column, A$1 will lock only the row. In this exercise we will need to lock the salary per day as we will need this number for calculating the approximate salary for each month.
Copy the table below and finish the calculations. Calculate first the salary per day, then for each month and afterwards the sum of the salaries to get the total for a year and average salary per month.

2. Constants II and percentages
Open the exercise from previous lesson, add a new cell to the table, in which you will store GDP (DPH in Slovak language) percentage. Calculate the price with GDP for each product, how much we will pay for the amount of item that we bought and the total price we will pay including GDP.
3. Constants, percentages and pie chart
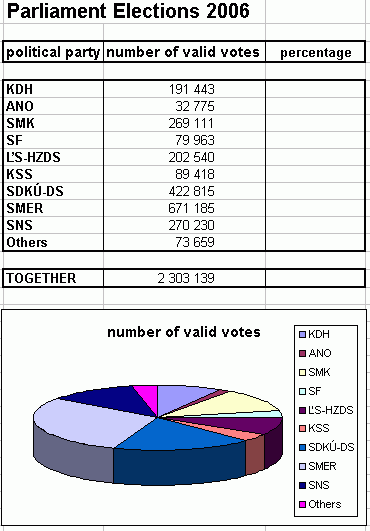
We use pie chart to show how individual items form a whole.
Copy the table showing the parliamentary elections in 2006. Calculate missing data - how many percents of the total voices did each party get. Create a pie chart to show how these percentages were distributed.

Create a second chart - this time a bar chart, to better compare the number of voices that each party got in the elections.
If we wish to use a constant in our calculations, we need to use sign $ inside the call to the cell where we have the constant. For example $A$1 will lock this cell inside the calculation and the number will stay the same even if we copy the calculation for numbers in other rows/columns. $A1 will lock only the column, A$1 will lock only the row. In this exercise we will need to lock the salary per day as we will need this number for calculating the approximate salary for each month.
Copy the table below and finish the calculations. Calculate first the salary per day, then for each month and afterwards the sum of the salaries to get the total for a year and average salary per month.

2. Constants II and percentages
Open the exercise from previous lesson, add a new cell to the table, in which you will store GDP (DPH in Slovak language) percentage. Calculate the price with GDP for each product, how much we will pay for the amount of item that we bought and the total price we will pay including GDP.
3. Constants, percentages and pie chart
We use pie chart to show how individual items form a whole.
Copy the table showing the parliamentary elections in 2006. Calculate missing data - how many percents of the total voices did each party get. Create a pie chart to show how these percentages were distributed.

Create a second chart - this time a bar chart, to better compare the number of voices that each party got in the elections.