G2A
Tabužky
Kontakt: palkovaj@yahoo.com
Dátum poslednej aktualizácie ... 27.januára 2008
12. Rozhodovanie II a náhodné hodnoty
 MYP1 |
MYP2 |
MYP3 |
MYP4 |
MYP5 |
G2A
1. Create a table of heights of the people in your IT group. Format the table and calculate the average, minimal and maximal height using the predefined functions.
You may get some inspiration here.
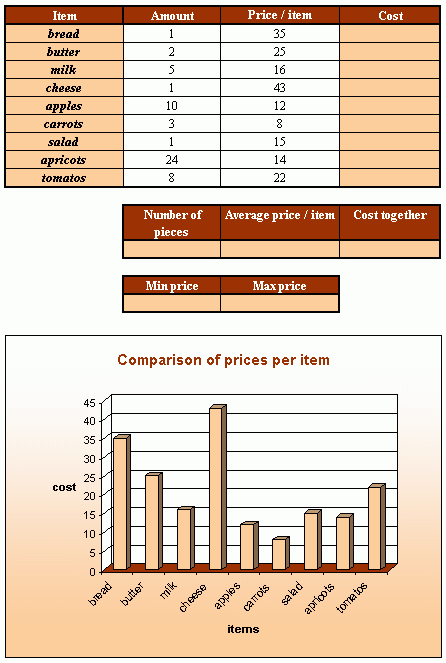
2. Copy the table on the picture below and calculate missing data. Afterwards create a comparison bar graph to show the differences in the prices. Format the table and the graph.

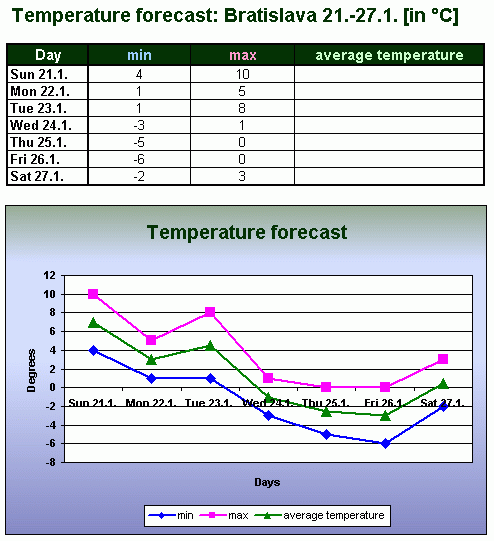
3. Find out the weather forecast for Bratislava for this week and create a table according to the example. Calculate the average temperatures and create a graph to show the accends and decends of the temperatures. Format the table and the graph.

2. Copy the table on the picture below and calculate missing data. Afterwards create a comparison bar graph to show the differences in the prices. Format the table and the graph.

3. Find out the weather forecast for Bratislava for this week and create a table according to the example. Calculate the average temperatures and create a graph to show the accends and decends of the temperatures. Format the table and the graph.
